
Marvellous mathematicians!
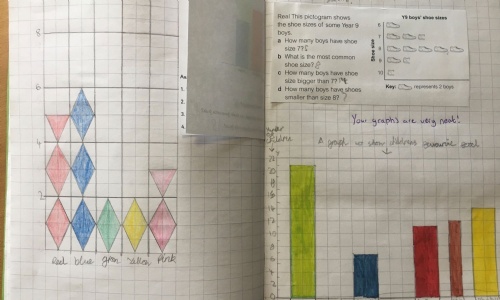
Group 2 have been working hard in maths lessons displaying and then analysing data.
Learners have been demonstrating ways to use Bar Graphs to represent data as well as converting other visualised data recordings like pictograms into bar graphs.
Learners have been able to clearly label their graphs, decide an accurate scale to use as well as then use their display of data to answer questions.